Table of contents
- Overview
- User Guide
- Community Feedback
- Developer Guide
- Deployment
- Development history
- Beyond the Basic
- Contact Us
Overview
Problem
The challenge is to develop a way for the college to visualize occupancy of the campus. The three current purposes are to assist in scheduling on the campus, assess social distancing and group density, and help with long term facility planning. The application is intended for the university administration. The data available is anonymized to protect the identities of the visitors to the campus.
Goals
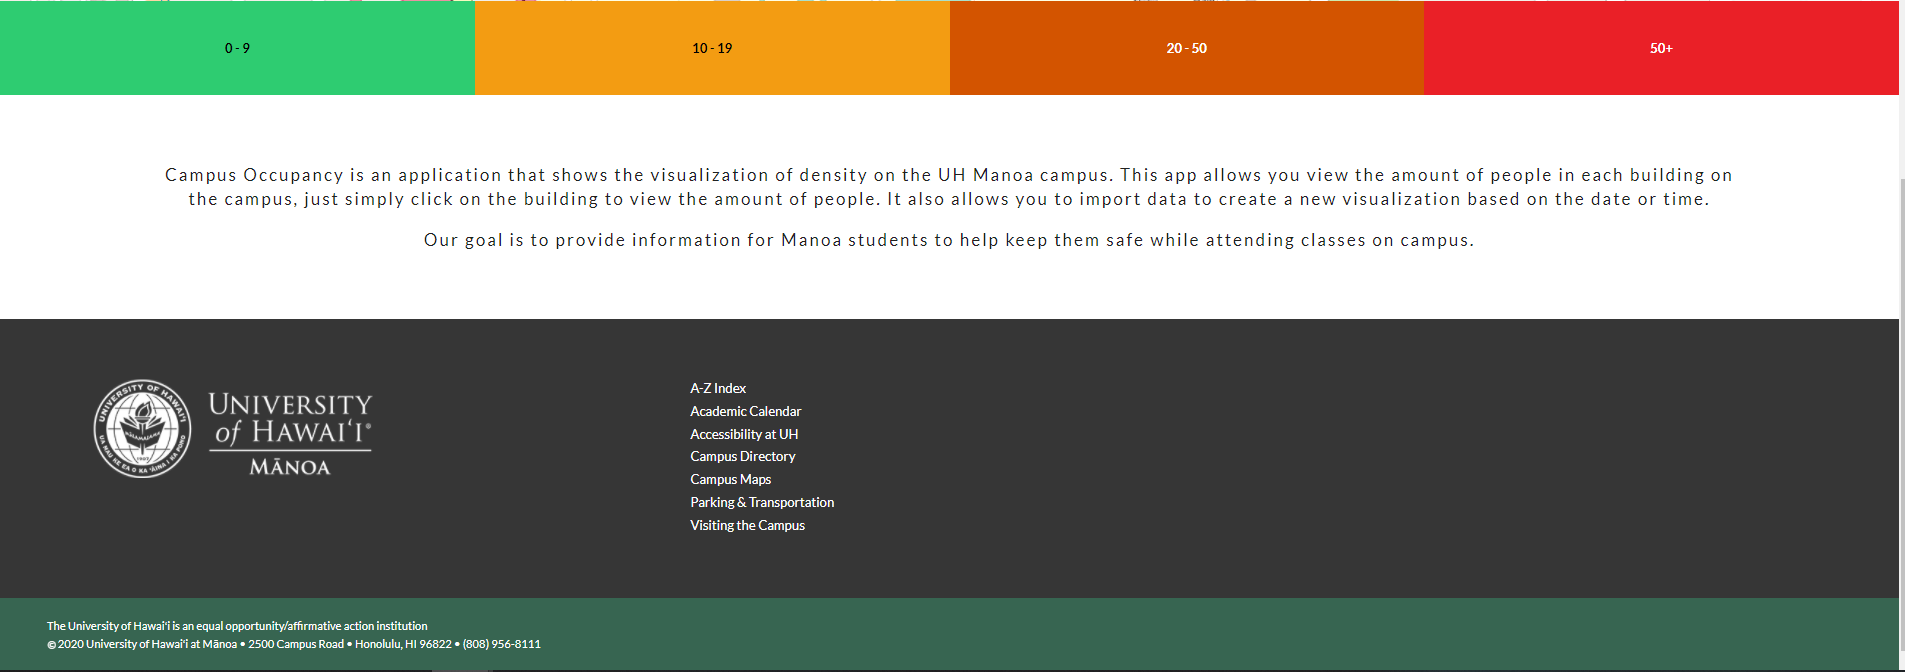
Campus Occupancy is an example web application that provides the visualization of the amount of people in a building. Basically the main goal is to have a map that can also show indoor grouping of visitors.
Planned Additions to project
We plan to add ease of access features to make the web application easier for the user. One of these additions would be a slider which filters the population of the building from most dense to least dense.
Mockup page Ideas
Implement visualizations with the D3 JavaScript library. Admin page displays the visualizations occupancy of the campus.

Case Ideas
The landing page will display the login. After logging in as an admin, the page is directed to the admin page. In this page it will display the visualized occupancy of the campus. There will be options for the admin user such as to edit or add data.
User Guide
This section provides the current walkthrough of the campus visualization user interface and its capabilities.
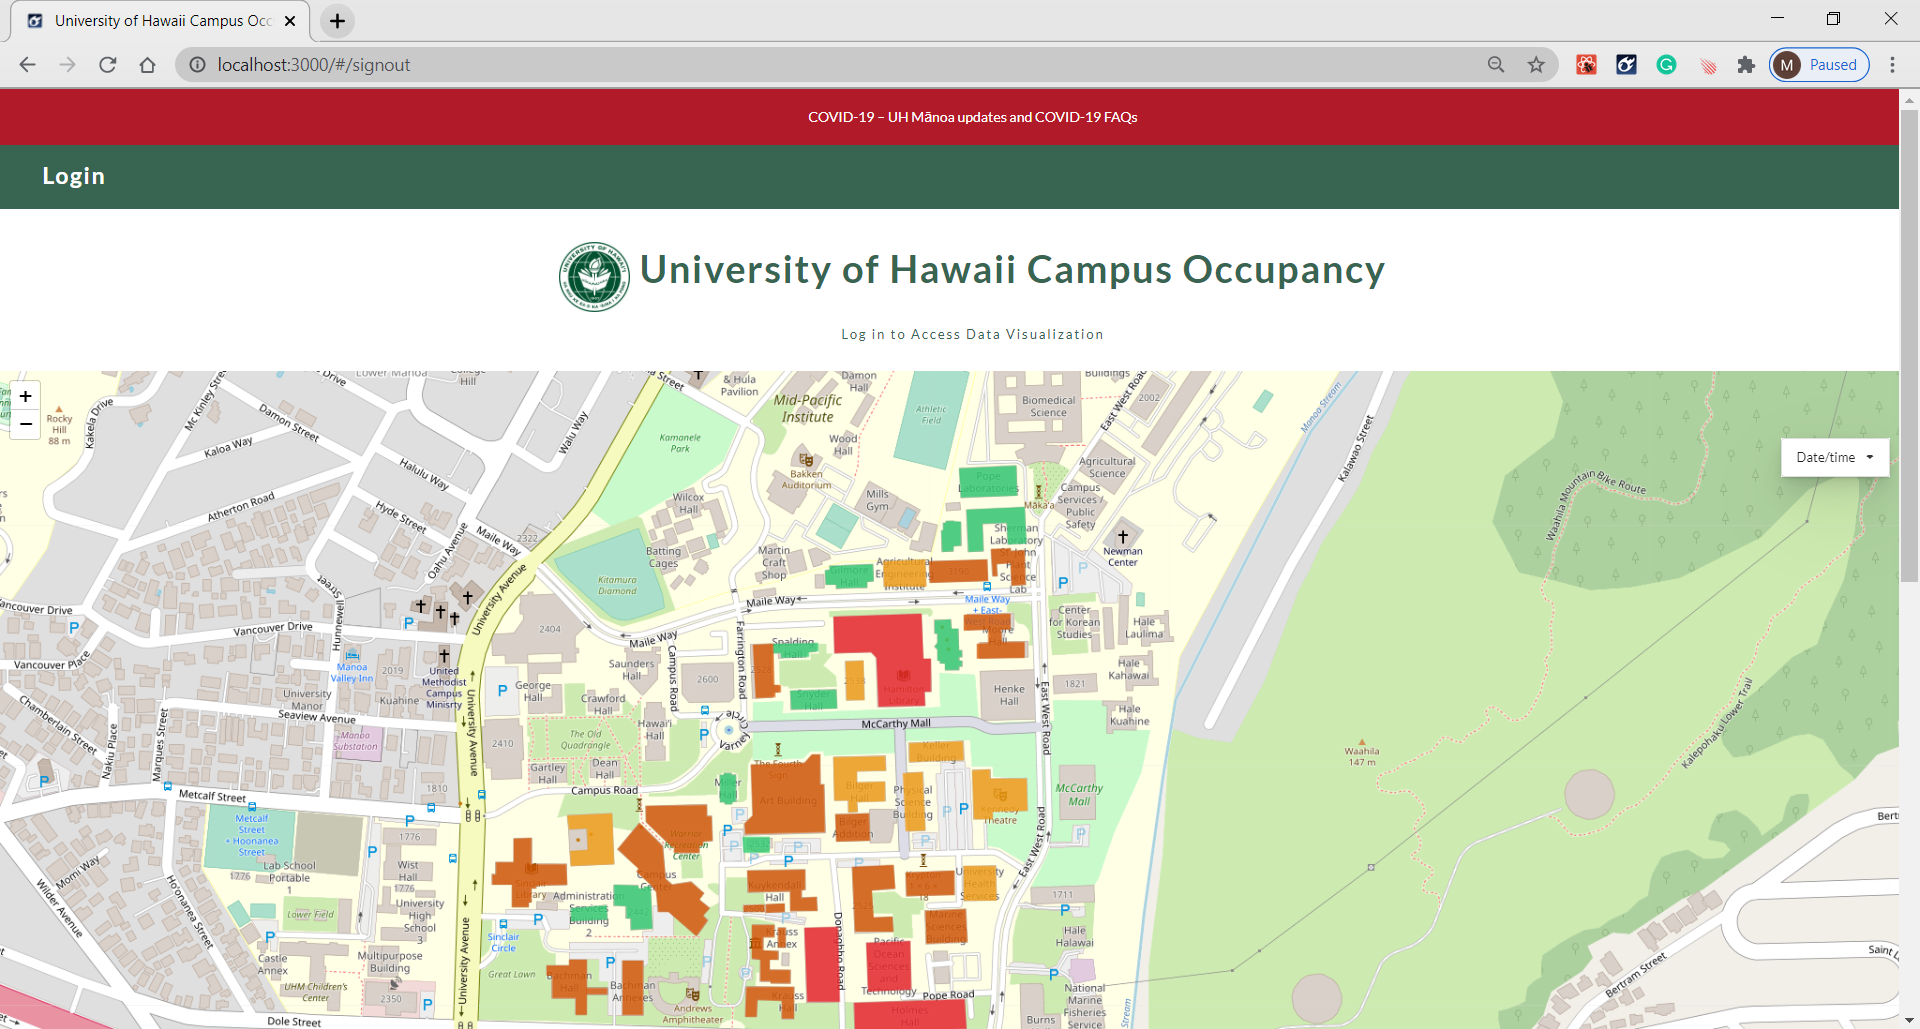
Landing Page
The landing page is presented to user when they visit the top-level URL to the site. In this page the user is able to see the map and the visualized data. Clicking on any one of the colored building will display a popup of the building name and the data. An extra feature was added to allow the user to select a Date Time and the data will appear for that time.
.PNG)
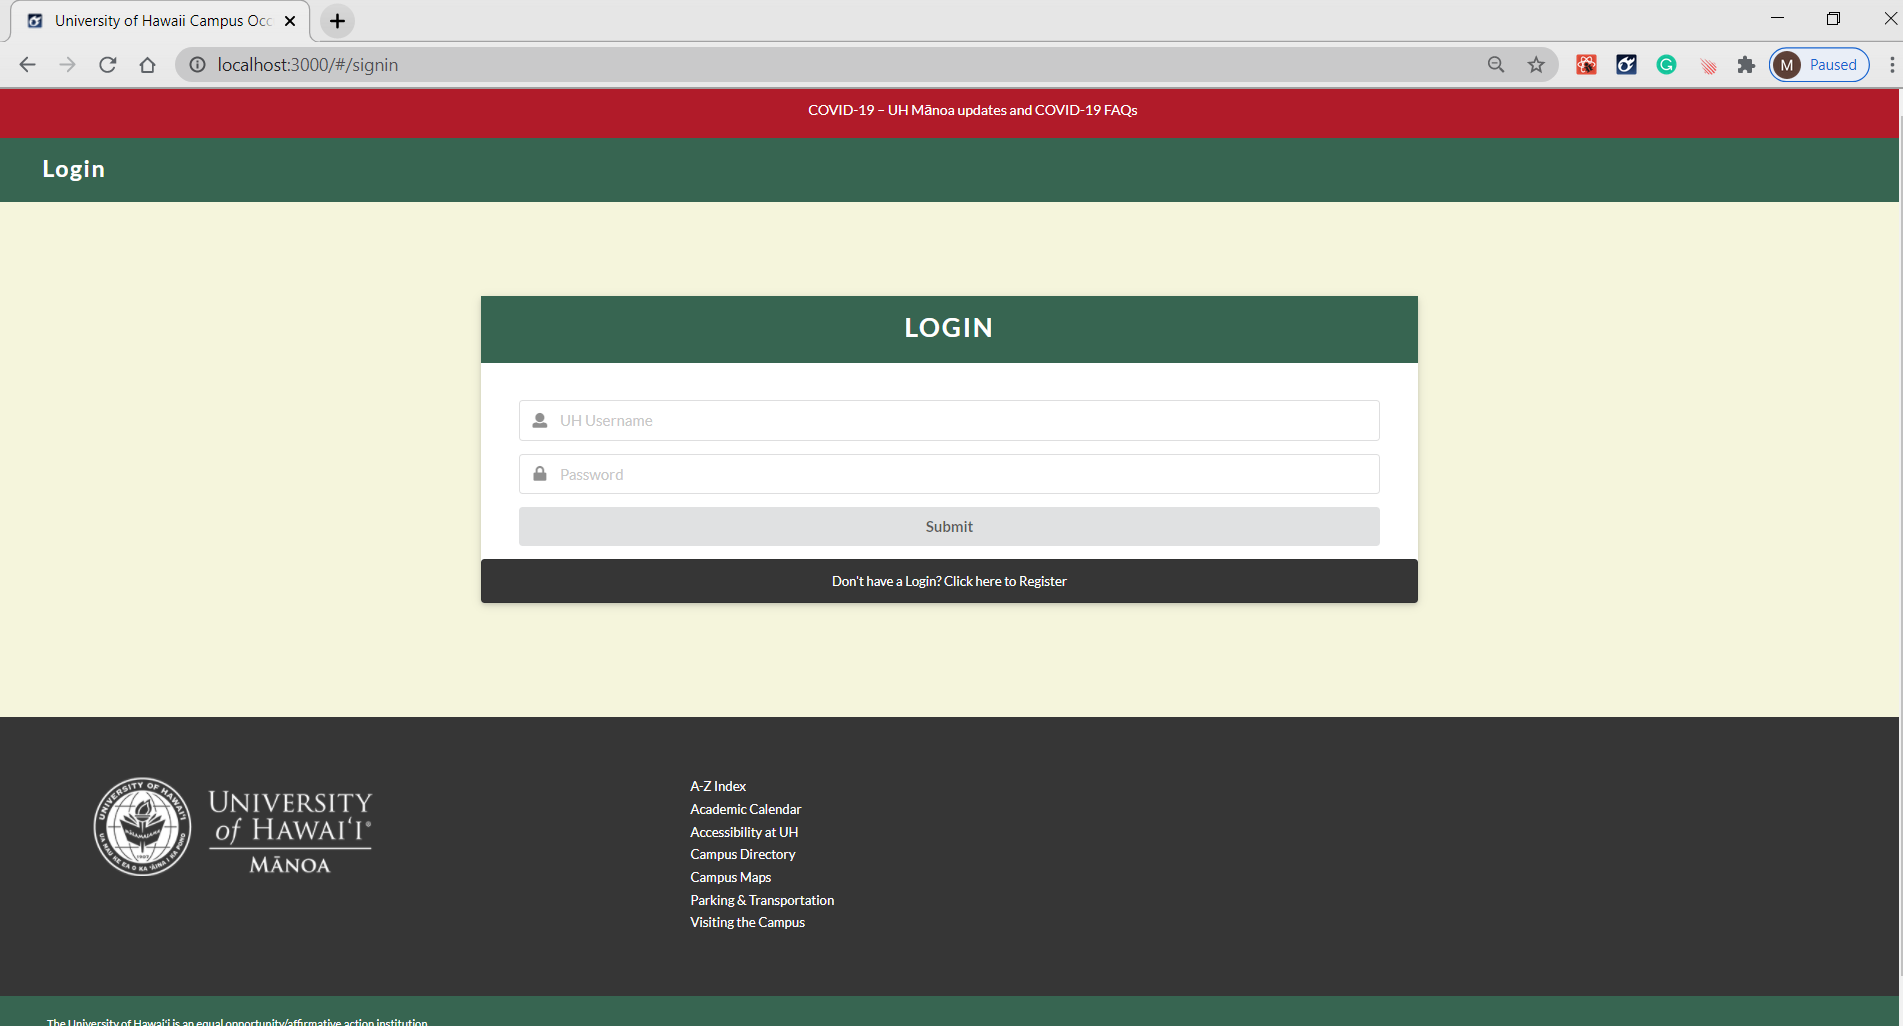
Sign in Page
Click on the “Login” button to go to Log in page and log in. You must have been previously registered with the system to login :
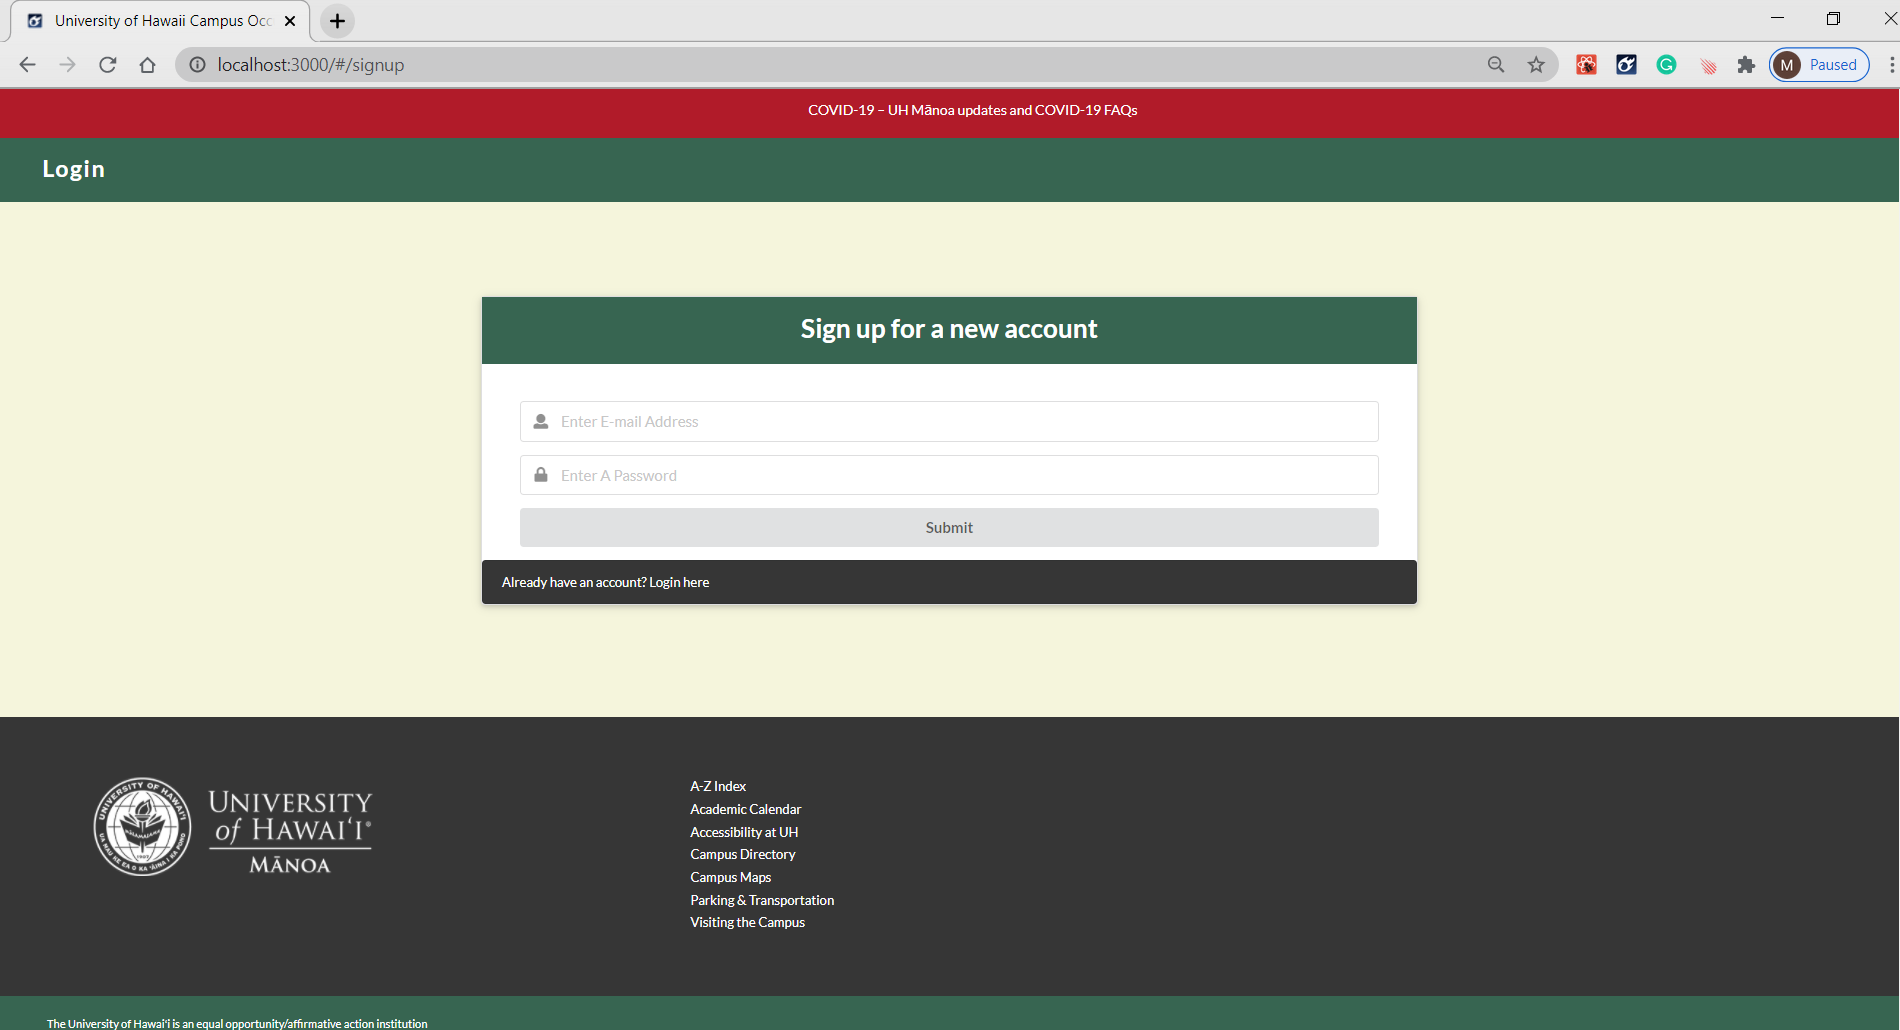
Sign up Page
If you are a new user, at the log in page click on “click here to Register”. Then Sign up for a new account :
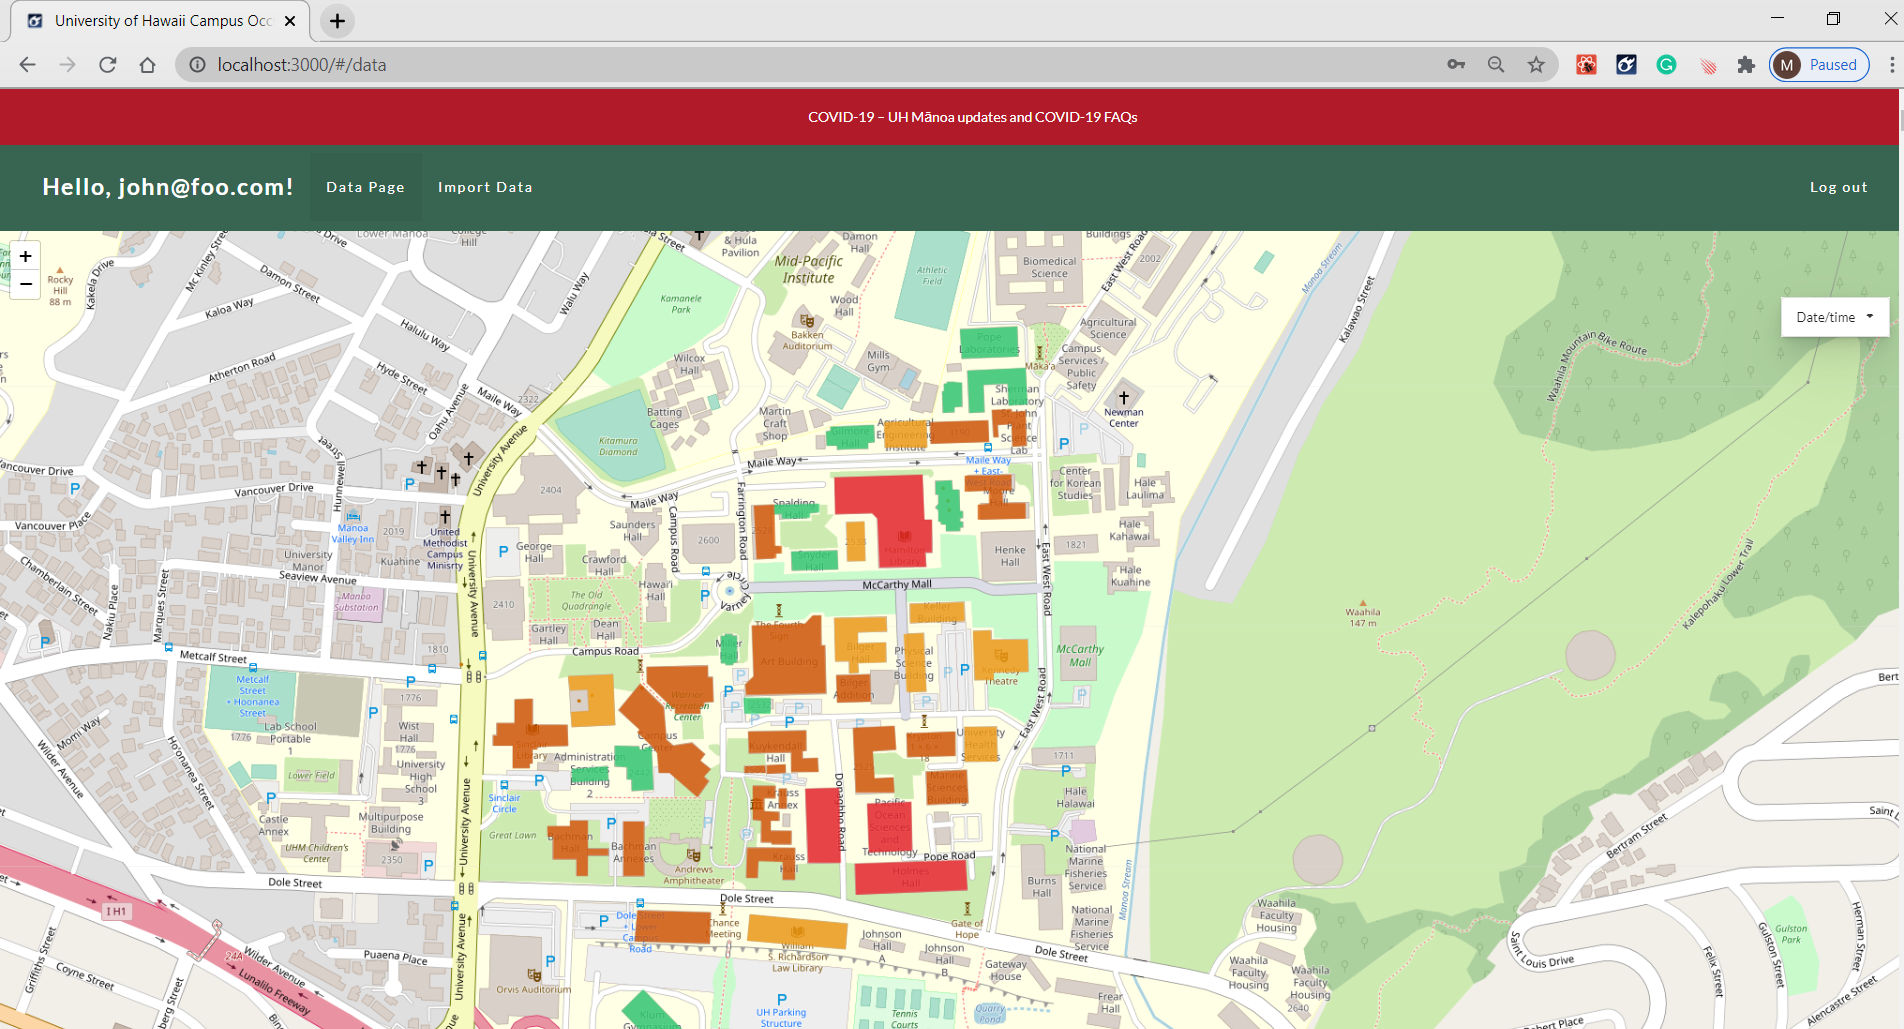
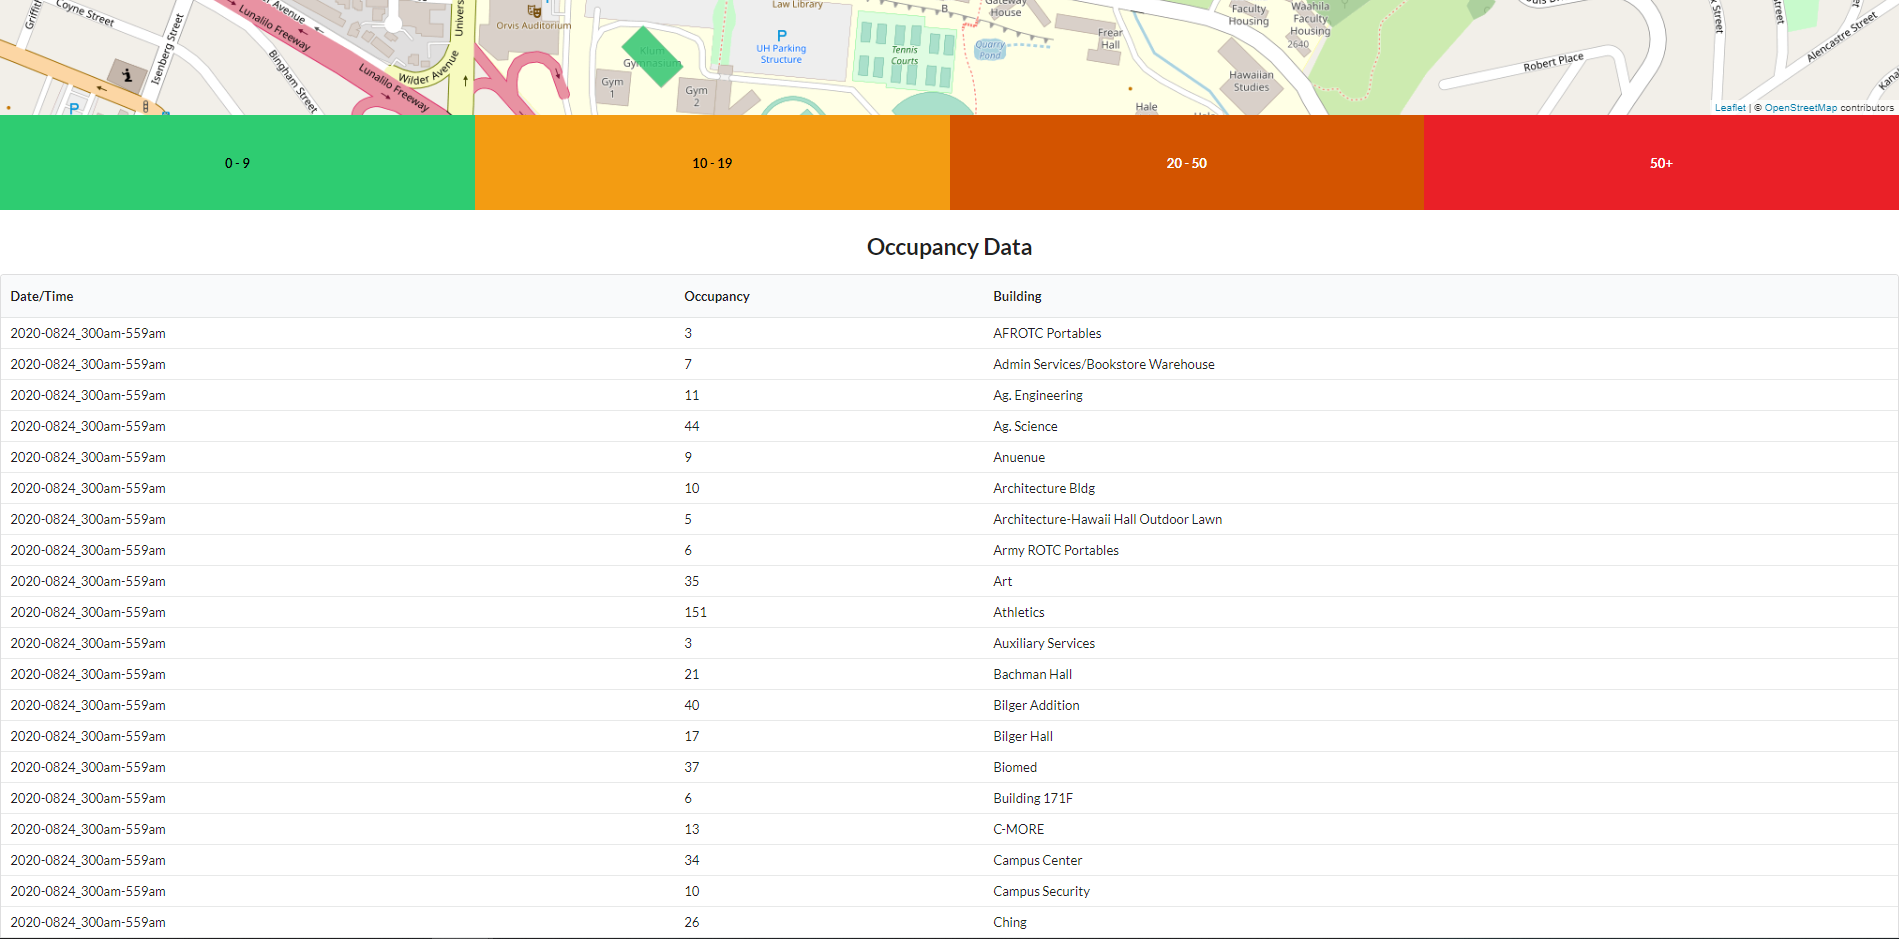
Data Page
After logging in or when you sign up for a new account, you are taken to the data page, which presents the map that the user can interact with. In this page a map is presented with the table below it. The table presents the data and the user is able to interact with the map:
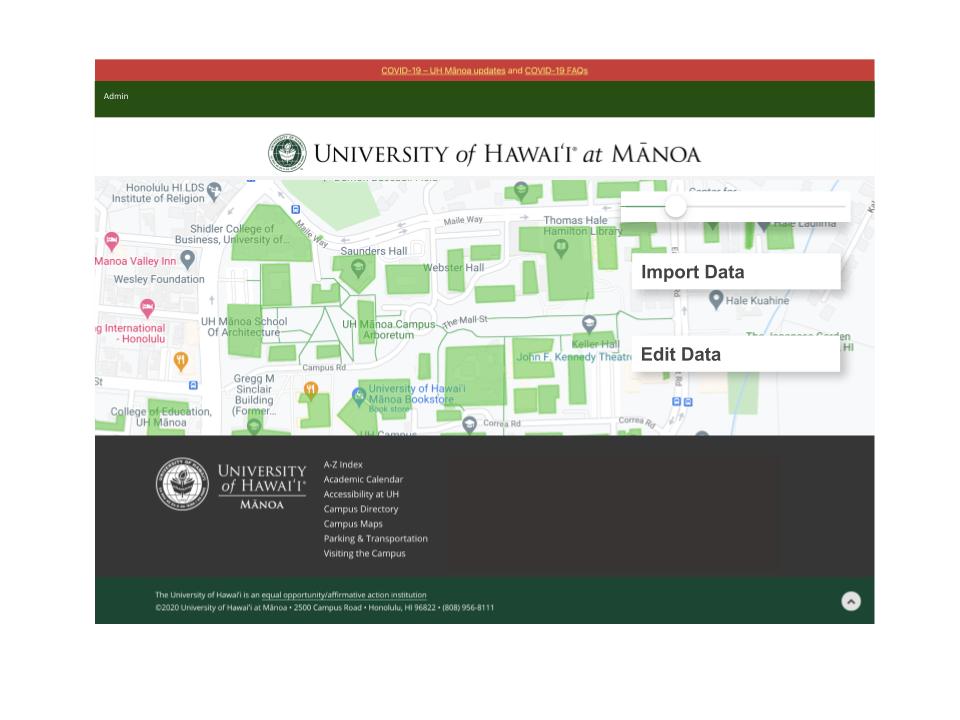
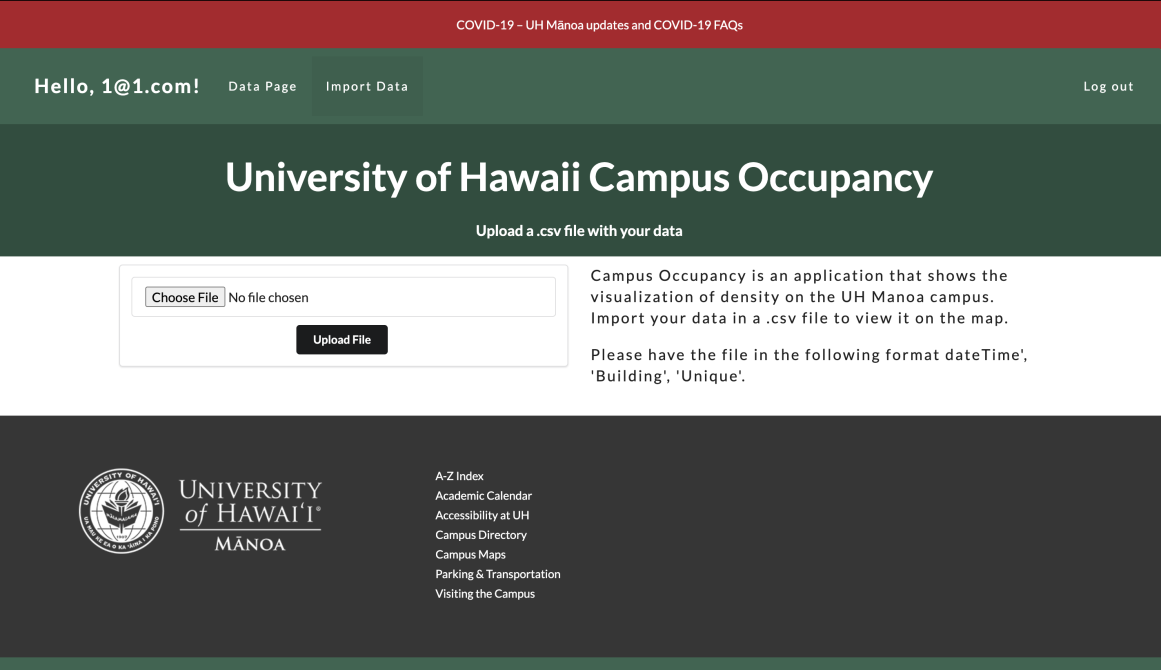
Edit Data page
Click on the Import Data tab. In this page you can import data by uploading a .csv file. The cvs file must contain the dateTime, Unique, Building and Device :
Developer Guide
This section provides information to any Meteor developers intrested in using this code for their own developement.
Installation
First, install Meteor.
Second go to https://github.com/campus-occupancy/campus-occupancy and click on the Green “Code” button to download the sources as a Zip file to create a copy of the application on your local computer. Alternatively, you may fork this repo.
Third, cd into the campus-occupancy/app directory and install the libraries with:
$ meteor npm install
Run the System
After downloading a copy of the application and installing the libraries, you can run the system with:
$ meteor npm run start
View the app
Once the app is running, the application will appear at http://localhost:3000/.
Run ESLint
To verify that your code complies with the coding standards, invoke ESLint from the command line with:
$ meteor npm run lint
Here is a sample output when no ESLint errors were detected:
$ meteor npm run lint

> bowfolios@ lint C:\Users\marco\github\campus-occupancy\app
> eslint --quiet --ext .jsx --ext .js ./imports ./tests

$
End to End Testing
Campus Occupancy uses TestCafe to provide the automated end-to-end testing. The Campus Occupancy test code employs the page model design.
To run the end-to-end test in developement mode, first run the campus occupancy application. Then on a separate console window invoke:
$ meteor npm run testcafe-development
A browser will appear to display the each of the test cases. If the test is successful, on the console window all the test cases should have a green check mark. Here is a sample output:
$ meteor npm run testcafe-development

> bowfolios@ testcafe-development C:\Users\marco\github\campus-occupancy\app
> testcafe chrome tests/*.testcafe.js

 Running tests in:
 - Chrome 87.0.4280.66 / Windows 10

 Campus-Occupancy localhost test with default db
 √ Test that landing page shows up
 √ Test Create New Account
 √ est that the login button at landing page works
 √ Test that signin and signout work
 √ Test that signup page, then logout works
 √ Test that Data page displays
 √ Test that Import data page displays


 8 passed (51s)
You can also run the testcafe tests in “continuous integration mode”. To do this, first check that the campus occupancy application is not running. Then, invoke meteor npm run testcafe-ci. No browser will appear but you can check the console to see if the test passed. Here is a sample output:
$ meteor npm run testcafe-ci

> bowfolios@ testcafe-ci C:\Users\marco\github\campus-occupancy\app
> testcafe chrome:headless tests/*.testcafe.js -q --app "meteor npm run start"

 Running tests in:
 - Chrome 87.0.4280.66 / Windows 10

 Campus-Occupancy localhost test with default db
 √ Test that landing page shows up
 √ Test Create New Account
 √ est that the login button at landing page works
 √ Test that signin and signout work
 √ Test that signup page, then logout works
 √ Test that Data page displays
 √ Test that Import data page displays


 8 passed (54s)
Continuous Integration
![]()
Campus-Occupancy uses GitHub Actions to automatically run ESLint and TestCafe each time a commit is done to the master Branch. You can see the results of all the workflow here.
The workflow file for this application is defined at .github/workflow/ci.yml.
Deployment:
Link to running deployment of UHManoaCampusOccupancy.
Link to Source Code:
Here is the link to the application repo containing the Source Code.
Link to the Campus Occupancy Repositories:
Here is the link to the organization Repositories.
Community Feedback
If you would like to help us improve the system, please take a couple of minutes to fill out the Campus Occupancy Form. We are intrested in your experiance using the application.
Feedbacks that we received:
- Our styling looked messed up and unappealing
- more clarification to the app
- Have more functionality for the map
- Add a loading to the page. There is no indactor that the if the page was still loading it is data.
- show more accurate data based on the square footage of the building
Community FeedBack Summary :
Some of the feed backs we got was, our application did not look appealing and was confusing. When the user first ran the application, they had no idea what the map was for or how to interact with the map. Also they suggested that we add more features to the map, such as changing the data on certain times. When the user logged in, they definetly noticed a lag. For instance, when the page was still rendering the data there was no loading to indicate that the page was trying to load the data.
Development history
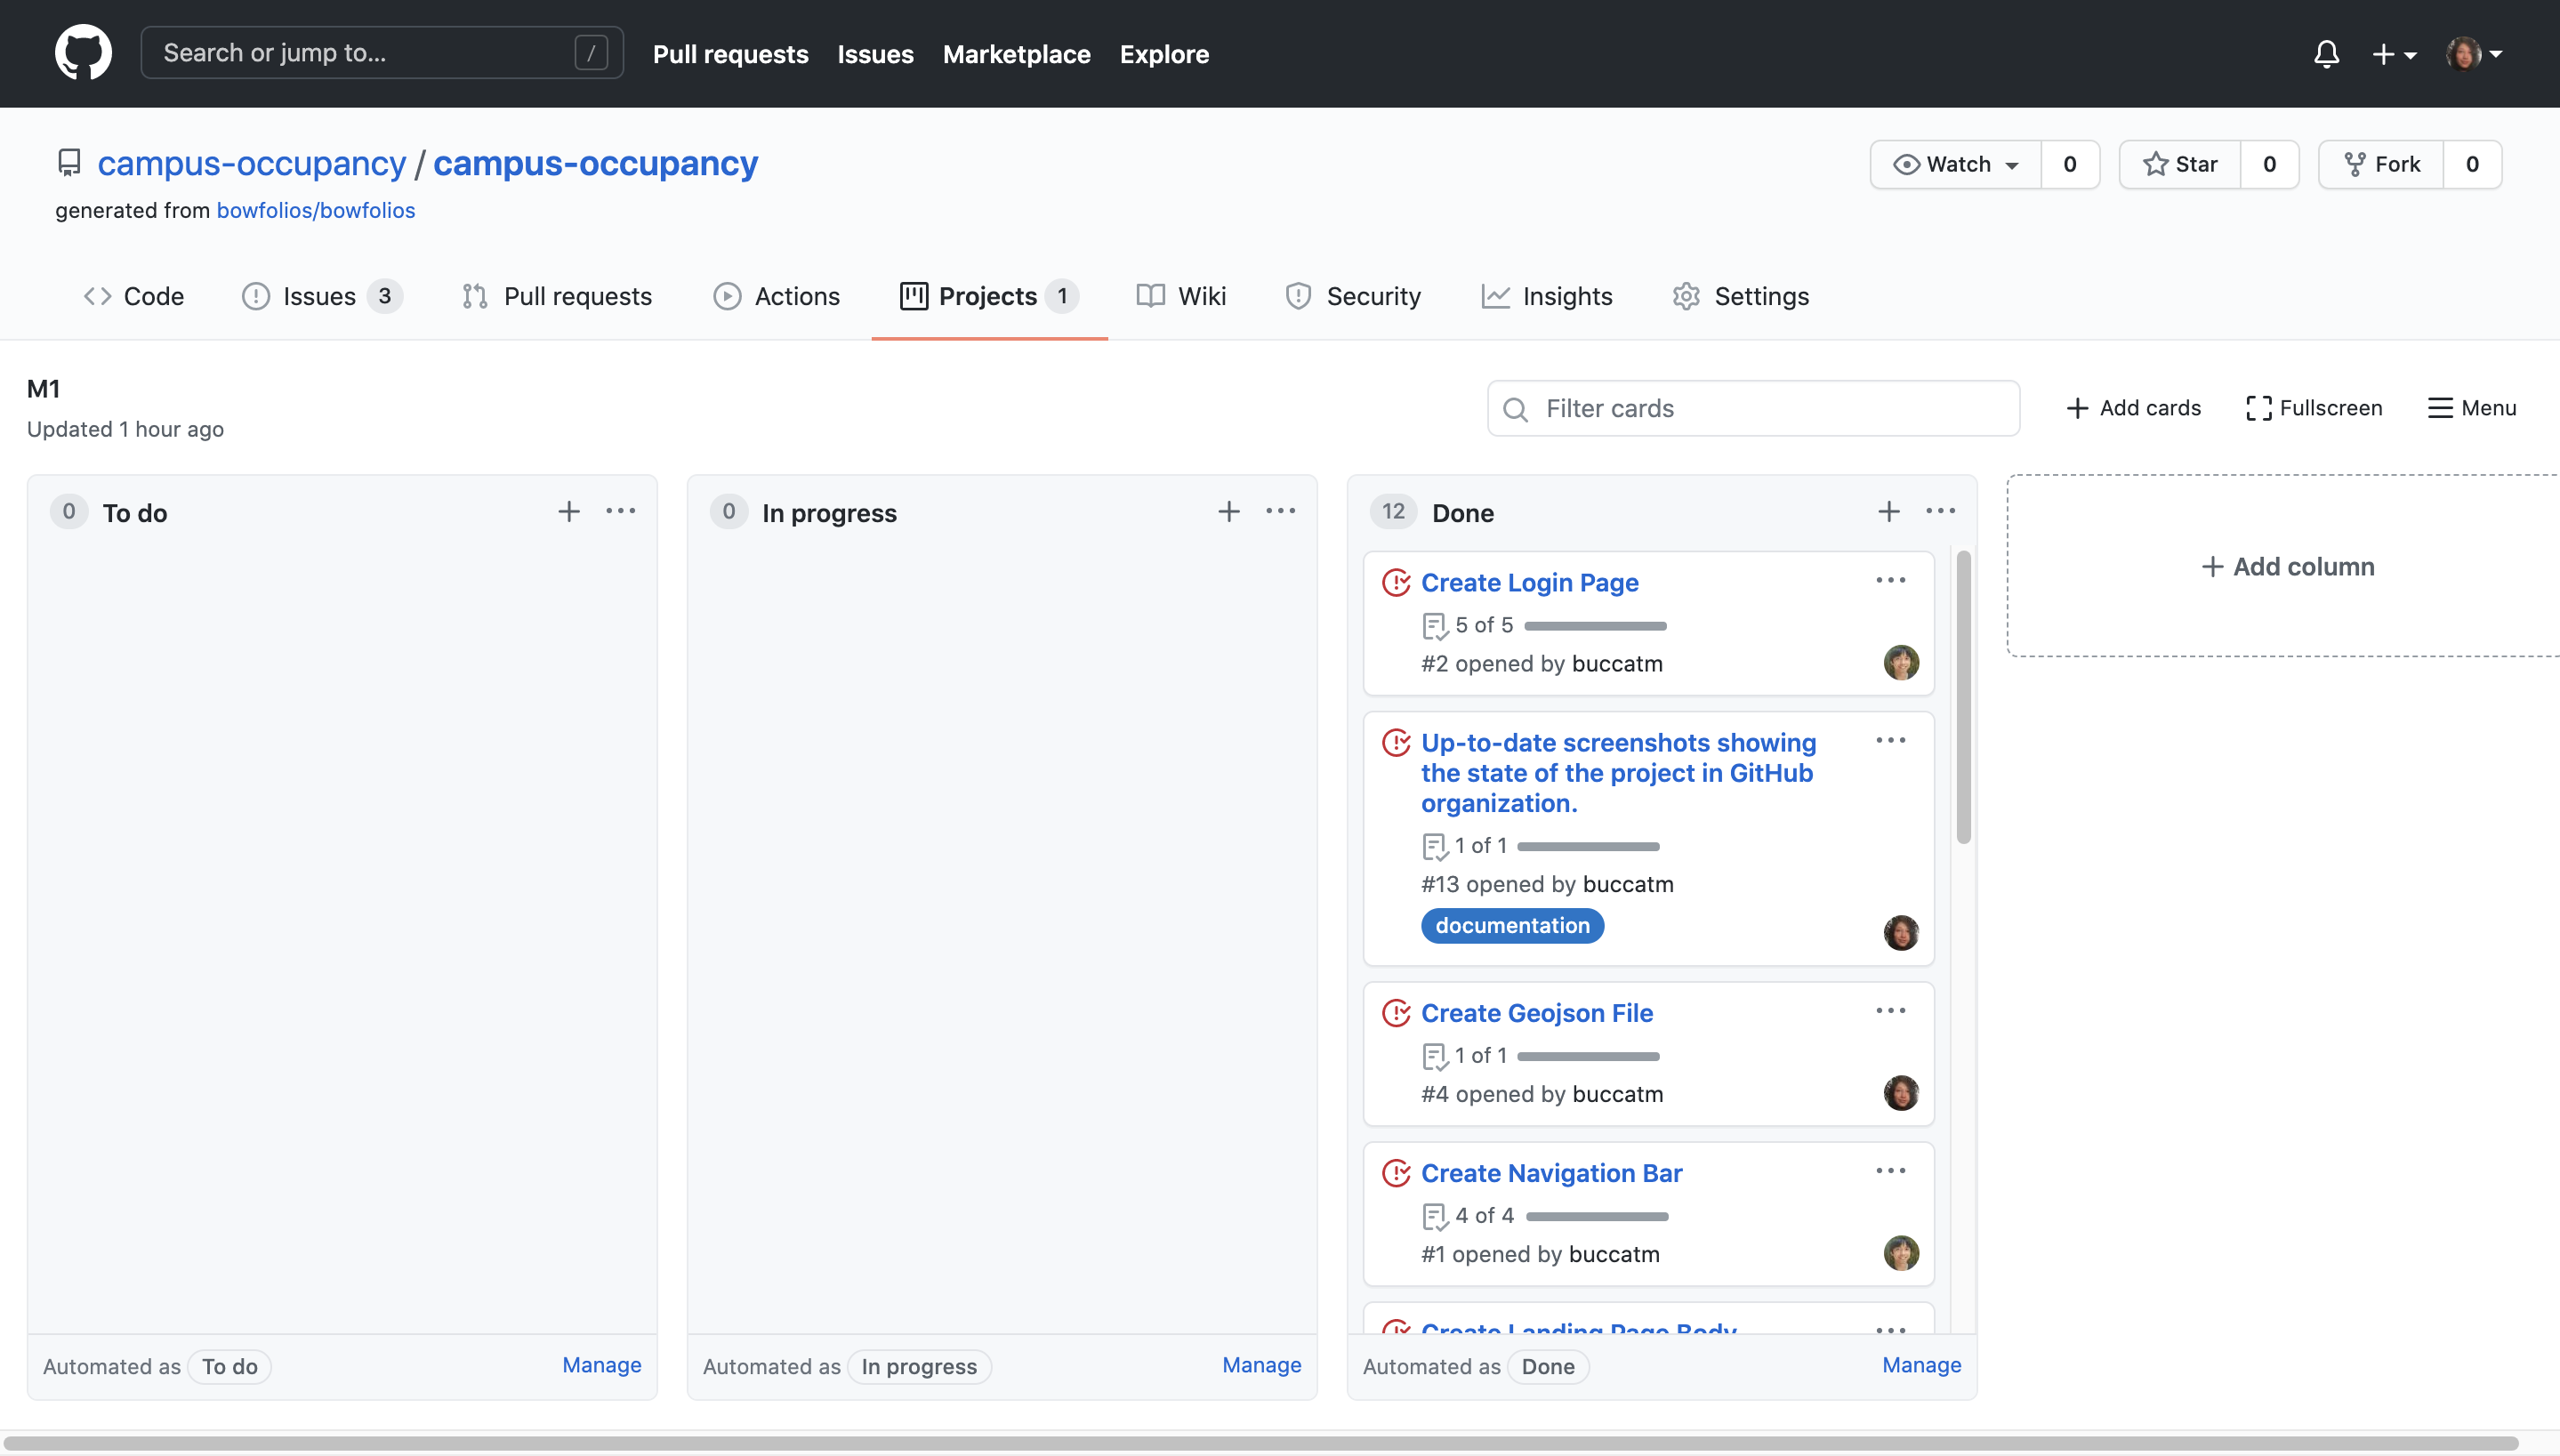
The campus occupancy project followed the Issue Driven Project Management Practices.
Milestone 1: Mockup development
The goal of Milestone 1 was to start devoloping a rough version of the mockups provided in the above section. Here is a link to Milestone 1
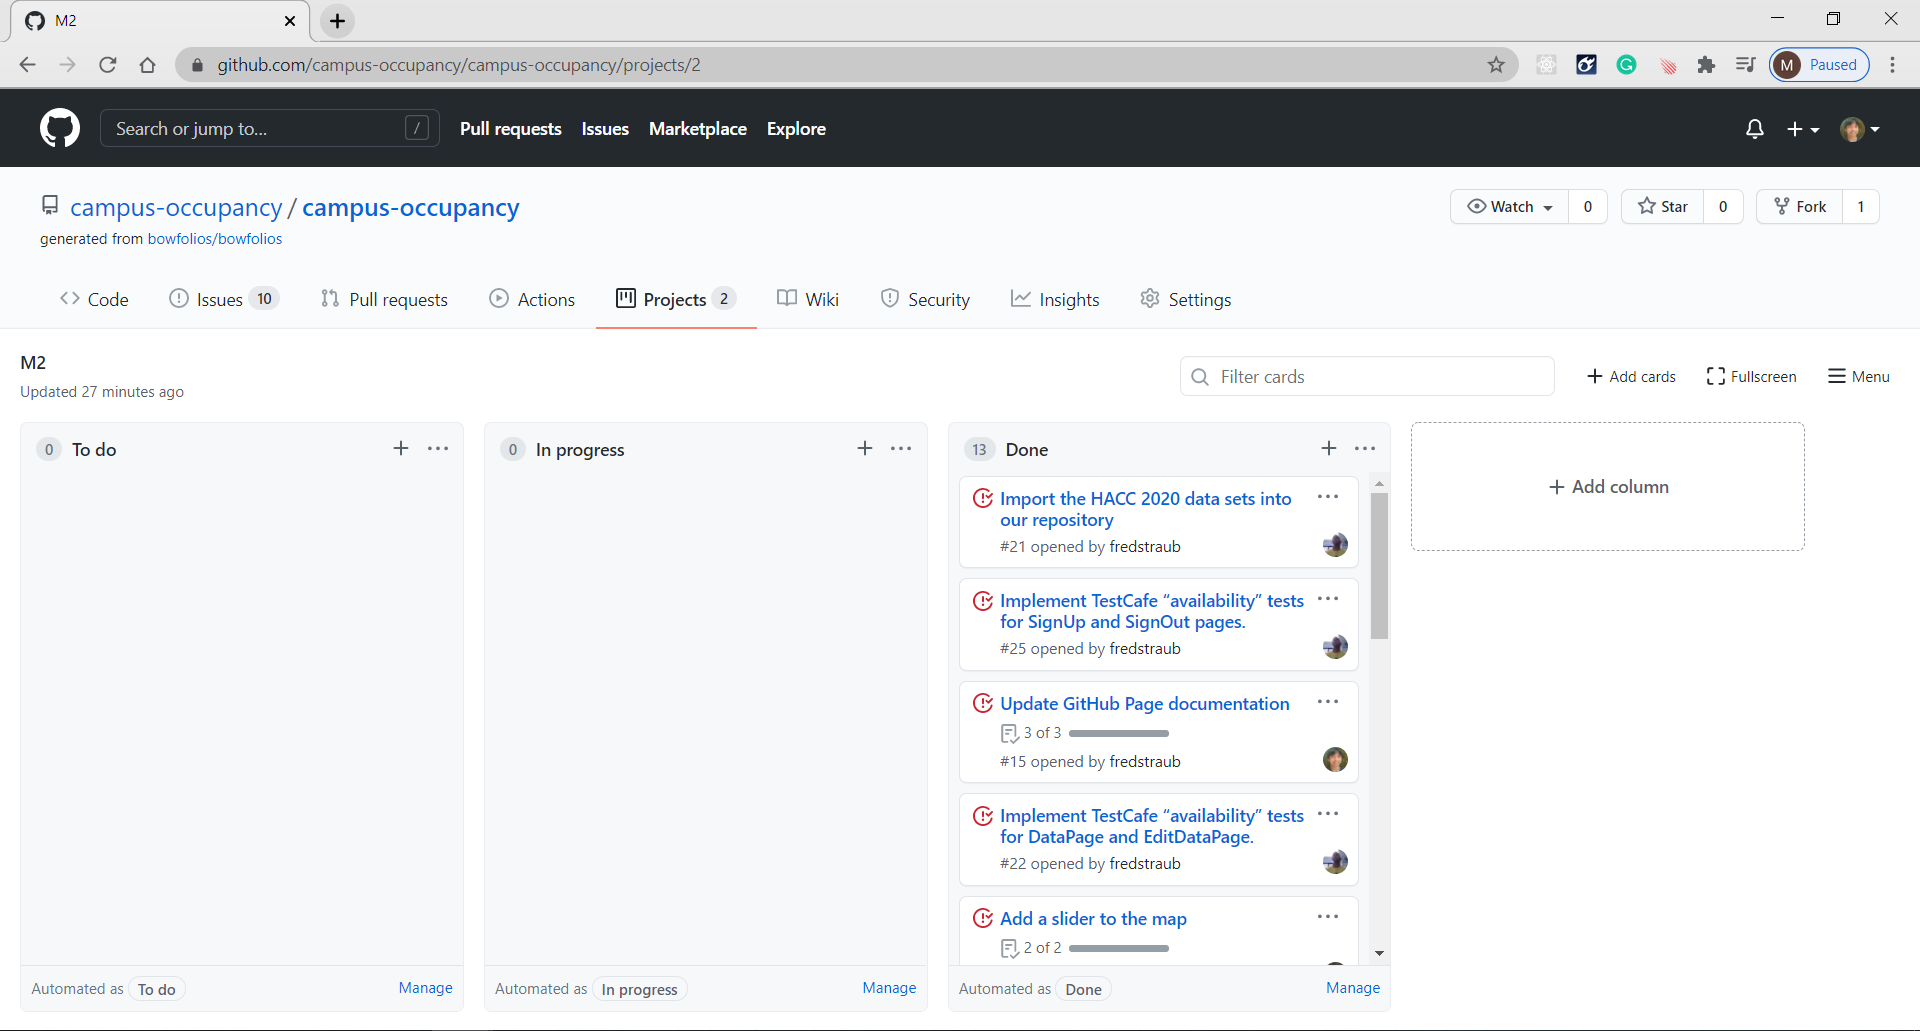
Milestone 2: Improvement to the System
The goal of Milestone 2 was to improve the functionality and quality of the application. So for Milestone 2, the goal was to get the map to visualize our data. Then test our system by implementing TestCafe “availability” tests for all our pages. Here is a link to Milestone 2
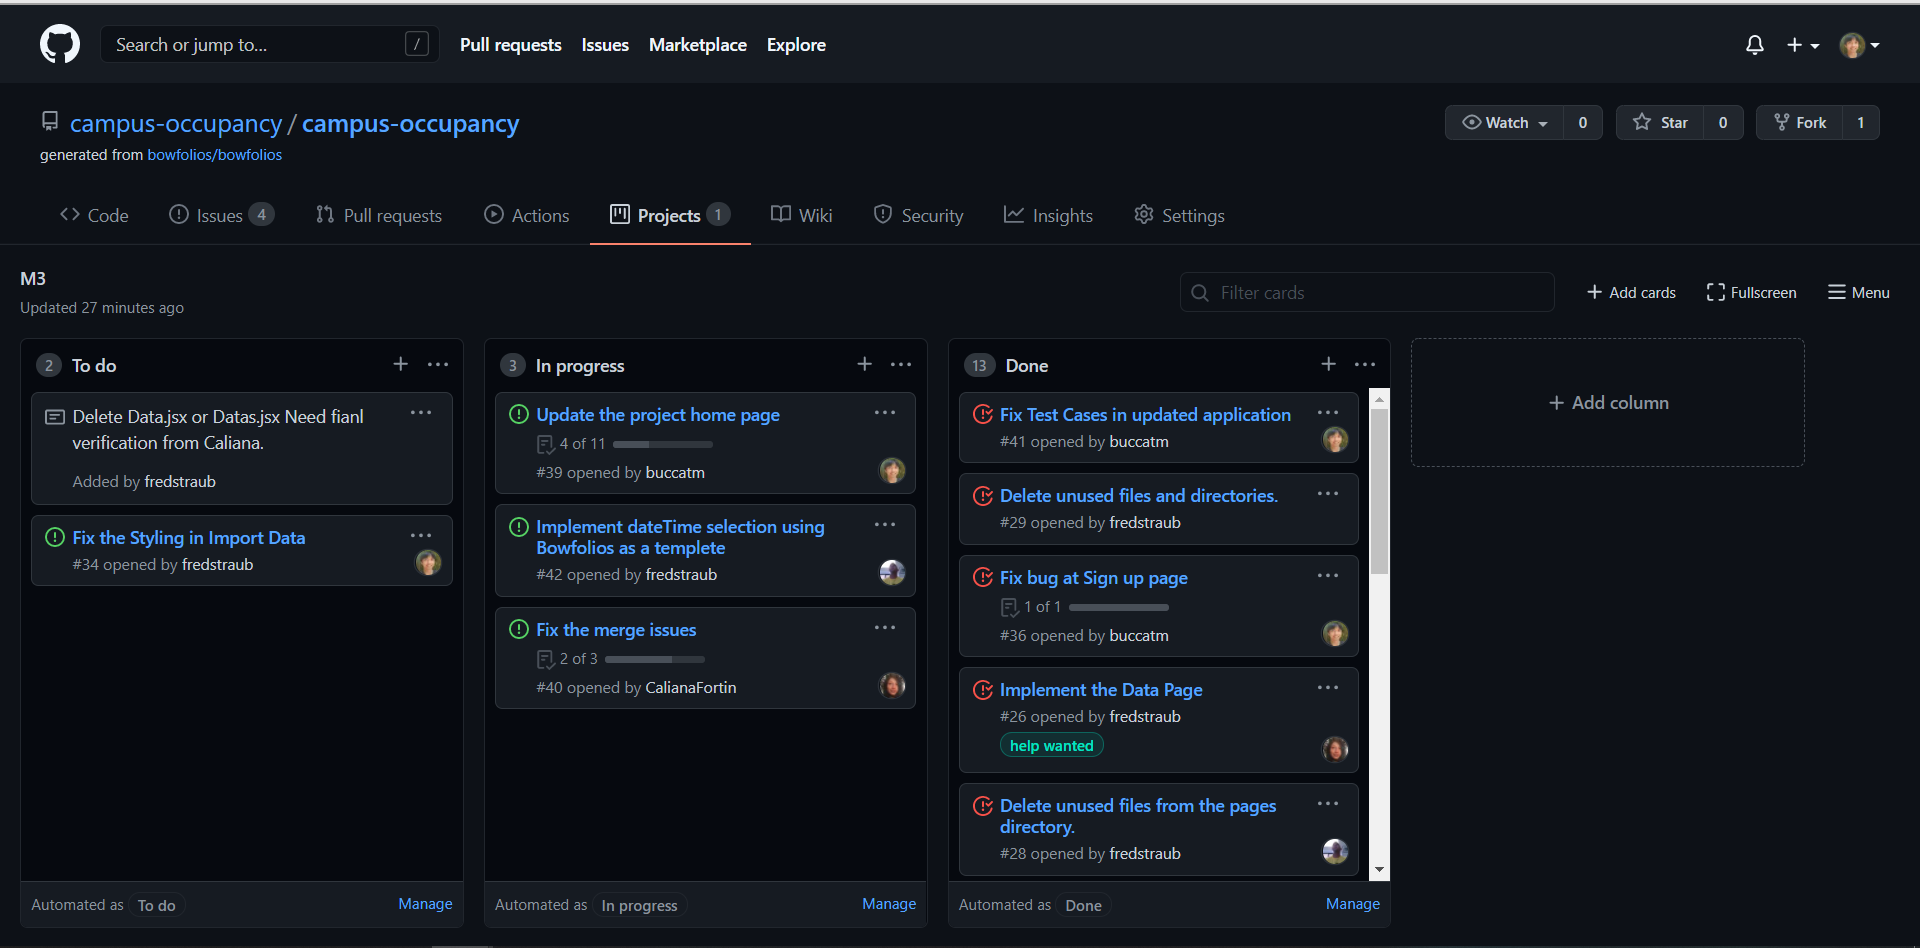
Milestone 3:
Beyond the Basic:
This application could be used to dispatch the campus security to monitor behavior if real-time data is used. It could also be used to direct cleaning crews on areas that need extra attention at the end of the day. The information collected on actual human traffic behavior, could be used to evaluate current emergency policies that the campus has in place including evacuation plans. Possible additional uses for this application include it being used as a framework for other facilities (schools, malls, public facilities) to monitor human traffic and group sizes. Additionally it would be beneficial to have the application be rendered in a three dimensional view, so that multi-level facilities can see exactly where the groups are.